
-
- Height:
- 6-4
-
- Year:
- 2
-
- Hometown:
- Douala, Cameroon
-
- High School:
- Collège Libermann
-
- Position:
- Guard
-
- Major:
- Civil Engineering
-
- gp
- 17
-
- pts/g
- 11.5
-
- fg %
- 38.8
-
- 3pt %
- 30.4
-
- ft %
- 75.6
-
- reb/g
- 5.1
-
- a/g
- 1.4
Bio
CAREER HONOURS
- OUA All-Rookie Team, 2022-23
- uOttawa Men's Rookie of the Year, 2022-23
SECOND YEAR (2023-24):
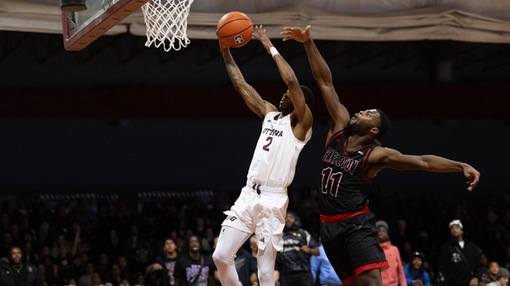
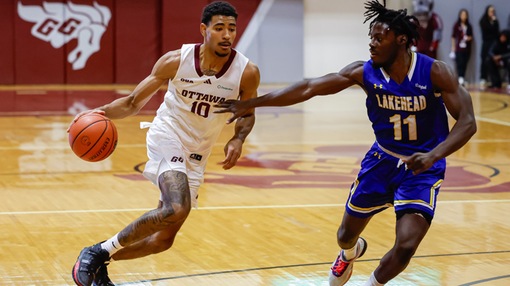
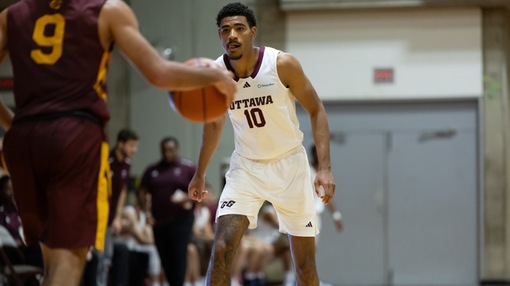
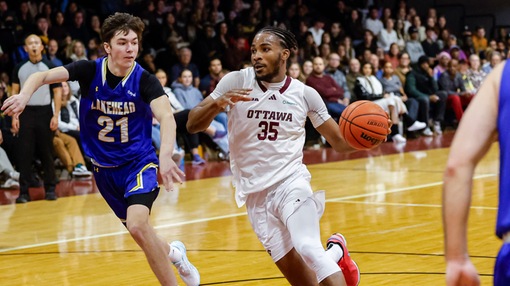
Appeared and started in 17 regular season games and started in all four post-season matchups for the Gee-Gees… Averaged 11.5 points, 5.1 rebounds, and 1.4 assists during regular season action… Scored season-high 25 points against Lakehead (Nov. 17, 2023).
FIRST YEAR (2022-23):
Appeared in all regular season and postseason games, as well as four pre-season games for the Gee-Gees… Finished the regular season averaging 7.2 points, 3.7 rebounds and 0.6 assists per game, earning a spot on the OUA All-Rookie Team… Averaged 7.3 points and 2.3 rebounds in 22.3 minutes per game during the National Championship tournament… Set career-high 26 points against Algoma (Dec. 2), adding six rebounds and a steal to his performance... Earned uOttawa’s Men’s Rookie of the Year honours.
BEFORE THE GEE-GEES:
From Douala, Cameroon, the Central African nation’s largest city... Attended Collège Libermann, where after graduation applied to attend universities in Canada... Attended Université de Moncton in New Brunswick and competed for Crandall University (ACAA), in limited exhibition games during the COVID-19 cancelled 2020-21 season... With no basketball program at Moncton, transferred to the University of Ottawa, joining the Gee-Gees in 2022.
Recent games
Season Statistics
| Overall | Conference | |
|---|---|---|
| Games | 17 | 17 |
| Games started | 17 | 17 |
| Minutes | 466 | 466 |
| Minutes per game | 27.4 | 27.4 |
| FG | 69-178 | 69-178 |
| FG Pct | 38.8 | 38.8 |
| 3PT | 24-79 | 24-79 |
| 3PT Pct | 30.4 | 30.4 |
| FT | 34-45 | 34-45 |
| FT Pct | 75.6 | 75.6 |
| Off rebounds | 25 | 25 |
| Def rebounds | 61 | 61 |
| Total rebounds | 86 | 86 |
| Rebounds per game | 5.1 | 5.1 |
| Personal fouls | 36 | 36 |
| Disqualifications | 1 | 1 |
| Assists | 23 | 23 |
| Turnovers | 25 | 25 |
| Assist to turnover ratio | 0.9 | 0.9 |
| Steals | 26 | 26 |
| Blocks | 3 | 3 |
| Points | 196 | 196 |
| Points per game | 11.5 | 11.5 |
| Points per 40 min | 16.8 | 16.8 |
Game Log - Shooting
| Date | Opponent | Score | gs | min | fg | pct | 3pt | pct | ft | pct | pts |
|---|---|---|---|---|---|---|---|---|---|---|---|
| Aug 22 | Harvard | W, 65-52 | - | 25 | 2-6 | 33.3 | 1-4 | 25.0 | 2-2 | 100.0 | 7 |
| Oct 12 | at UBC Okanagan | W, 99-76 | 1 | 27 | 6-13 | 46.2 | 3-7 | 42.9 | 3-5 | 60.0 | 18 |
| Oct 13 | Trinity Western | W, 74-48 | 1 | 23 | 5-11 | 45.5 | 2-4 | 50.0 | 1-2 | 50.0 | 13 |
| Oct 14 | at StFX | W, 90-66 | 1 | 24 | 4-9 | 44.4 | 2-6 | 33.3 | 1-1 | 100.0 | 11 |
| Oct 20 | Concordia | W, 81-56 | 1 | 29 | 5-11 | 45.5 | 2-7 | 28.6 | 1-2 | 50.0 | 13 |
| Nov 3 | at Guelph | W, 86-66 | 1 | 21 | 5-7 | 71.4 | 1-2 | 50.0 | 2-2 | 100.0 | 13 |
| Nov 10 | at Windsor | W, 81-68 | 1 | 30 | 2-11 | 18.2 | 1-6 | 16.7 | 3-5 | 60.0 | 8 |
| Nov 11 | at Western | W, 84-77 | 1 | 25 | 8-19 | 42.1 | 2-8 | 25.0 | 1-1 | 100.0 | 19 |
| Nov 17 | Lakehead | W, 97-81 | 1 | 33 | 9-17 | 52.9 | 1-5 | 20.0 | 6-6 | 100.0 | 25 |
| Nov 18 | Brock | W, 73-63 | 1 | 25 | 1-7 | 14.3 | 1-5 | 20.0 | 0-2 | 0.0 | 3 |
| Nov 24 | at Nipissing | W, 97-69 | 1 | 21 | 6-9 | 66.7 | 2-3 | 66.7 | 5-7 | 71.4 | 19 |
| Nov 25 | at Laurentian | W, 84-59 | 1 | 20 | 1-7 | 14.3 | 0-1 | 0.0 | 0-0 | - | 2 |
| Dec 1 | at York | W, 86-75 | 1 | 28 | 5-9 | 55.6 | 2-3 | 66.7 | 2-2 | 100.0 | 14 |
| Dec 2 | at McMaster | W, 72-59 | 1 | 35 | 4-9 | 44.4 | 2-6 | 33.3 | 0-0 | - | 10 |
| Dec 6 | Carleton | W, 79-78 | 1 | 29 | 4-14 | 28.6 | 0-3 | 0.0 | 1-2 | 50.0 | 9 |
| Dec 28 | Winnipeg | W, 78-67 | 1 | 25 | 7-13 | 53.8 | 0-5 | 0.0 | 1-2 | 50.0 | 15 |
| Dec 29 | vs. StFX | L, 104-81 | 1 | 28 | 1-4 | 25.0 | 0-2 | 0.0 | 1-2 | 50.0 | 3 |
| Dec 30 | at Laval | W, 90-60 | 1 | 23 | 7-15 | 46.7 | 4-10 | 40.0 | 0-2 | 0.0 | 18 |
| Jan 5 | Queen's | L, 96-95 | - | - | - | - | - | - | - | - | - |
| Jan 6 | Ontario Tech | W, 75-65 | - | - | - | - | - | - | - | - | - |
| Jan 12 | Laurentian | W, 69-56 | - | - | - | - | - | - | - | - | - |
| Jan 13 | Nipissing | W, 79-56 | - | - | - | - | - | - | - | - | - |
| Jan 19 | at Algoma | W, 87-50 | - | - | - | - | - | - | - | - | - |
| Jan 26 | Waterloo | W, 63-46 | 1 | 29 | 4-12 | 33.3 | 1-5 | 20.0 | 5-6 | 83.3 | 14 |
| Jan 27 | Laurier | W, 75-67 | 1 | 33 | 6-12 | 50.0 | 5-8 | 62.5 | 0-0 | - | 17 |
| Feb 2 | vs. Carleton | W, 71-61 | 1 | 26 | 1-8 | 12.5 | 0-4 | 0.0 | 2-2 | 100.0 | 4 |
| Feb 9 | Toronto Metropolitan | W, 69-52 | 1 | 24 | 3-8 | 37.5 | 1-4 | 25.0 | 2-2 | 100.0 | 9 |
| Feb 10 | Toronto | L, 76-70 | 1 | 21 | 2-7 | 28.6 | 1-4 | 25.0 | 2-4 | 50.0 | 7 |
| Feb 16 | at Queen's | L, 89-88 | 1 | 37 | 4-10 | 40.0 | 4-7 | 57.1 | 3-4 | 75.0 | 15 |
| Feb 17 | at Ontario Tech | W, 69-66 | 1 | 29 | 4-12 | 33.3 | 0-5 | 0.0 | 0-0 | - | 8 |
Game Log - Ball control
| Date | Opponent | Score | gs | min | off | def | reb | ast | to | stl | blk |
|---|---|---|---|---|---|---|---|---|---|---|---|
| Aug 22 | Harvard | W, 65-52 | - | 25 | 1 | 3 | 4 | 2 | 1 | 2 | 0 |
| Oct 12 | at UBC Okanagan | W, 99-76 | 1 | 27 | 0 | 4 | 4 | 0 | 2 | 0 | 1 |
| Oct 13 | Trinity Western | W, 74-48 | 1 | 23 | 2 | 4 | 6 | 1 | 2 | 3 | 0 |
| Oct 14 | at StFX | W, 90-66 | 1 | 24 | 0 | 3 | 3 | 4 | 2 | 3 | 1 |
| Oct 20 | Concordia | W, 81-56 | 1 | 29 | 2 | 6 | 8 | 1 | 3 | 1 | 0 |
| Nov 3 | at Guelph | W, 86-66 | 1 | 21 | 1 | 2 | 3 | 1 | 3 | 0 | 0 |
| Nov 10 | at Windsor | W, 81-68 | 1 | 30 | 2 | 4 | 6 | 3 | 2 | 1 | 1 |
| Nov 11 | at Western | W, 84-77 | 1 | 25 | 3 | 2 | 5 | 1 | 2 | 2 | 0 |
| Nov 17 | Lakehead | W, 97-81 | 1 | 33 | 2 | 4 | 6 | 0 | 1 | 2 | 0 |
| Nov 18 | Brock | W, 73-63 | 1 | 25 | 2 | 6 | 8 | 3 | 1 | 0 | 0 |
| Nov 24 | at Nipissing | W, 97-69 | 1 | 21 | 4 | 7 | 11 | 3 | 1 | 2 | 0 |
| Nov 25 | at Laurentian | W, 84-59 | 1 | 20 | 2 | 2 | 4 | 2 | 1 | 1 | 0 |
| Dec 1 | at York | W, 86-75 | 1 | 28 | 2 | 3 | 5 | 1 | 2 | 2 | 1 |
| Dec 2 | at McMaster | W, 72-59 | 1 | 35 | 1 | 2 | 3 | 0 | 0 | 0 | 0 |
| Dec 6 | Carleton | W, 79-78 | 1 | 29 | 0 | 5 | 5 | 0 | 1 | 4 | 0 |
| Dec 28 | Winnipeg | W, 78-67 | 1 | 25 | 3 | 5 | 8 | 0 | 2 | 2 | 0 |
| Dec 29 | vs. StFX | L, 104-81 | 1 | 28 | 0 | 2 | 2 | 1 | 3 | 2 | 0 |
| Dec 30 | at Laval | W, 90-60 | 1 | 23 | 0 | 4 | 4 | 1 | 1 | 1 | 0 |
| Jan 5 | Queen's | L, 96-95 | - | - | - | - | - | - | - | - | - |
| Jan 6 | Ontario Tech | W, 75-65 | - | - | - | - | - | - | - | - | - |
| Jan 12 | Laurentian | W, 69-56 | - | - | - | - | - | - | - | - | - |
| Jan 13 | Nipissing | W, 79-56 | - | - | - | - | - | - | - | - | - |
| Jan 19 | at Algoma | W, 87-50 | - | - | - | - | - | - | - | - | - |
| Jan 26 | Waterloo | W, 63-46 | 1 | 29 | 1 | 2 | 3 | 1 | 1 | 5 | 0 |
| Jan 27 | Laurier | W, 75-67 | 1 | 33 | 1 | 4 | 5 | 0 | 3 | 1 | 0 |
| Feb 2 | vs. Carleton | W, 71-61 | 1 | 26 | 0 | 3 | 3 | 0 | 0 | 2 | 0 |
| Feb 9 | Toronto Metropolitan | W, 69-52 | 1 | 24 | 2 | 4 | 6 | 2 | 3 | 0 | 0 |
| Feb 10 | Toronto | L, 76-70 | 1 | 21 | 1 | 2 | 3 | 1 | 0 | 0 | 1 |
| Feb 16 | at Queen's | L, 89-88 | 1 | 37 | 0 | 5 | 5 | 4 | 3 | 2 | 0 |
| Feb 17 | at Ontario Tech | W, 69-66 | 1 | 29 | 1 | 4 | 5 | 1 | 1 | 2 | 0 |
Game Log - Ball control extended
| Date | Opponent | Score | gs | pf | dq | a/to |
|---|---|---|---|---|---|---|
| Aug 22 | Harvard | W, 65-52 | - | 2 | - | 2.0 |
| Oct 12 | at UBC Okanagan | W, 99-76 | 1 | 2 | 0 | 0.0 |
| Oct 13 | Trinity Western | W, 74-48 | 1 | 0 | 0 | 0.5 |
| Oct 14 | at StFX | W, 90-66 | 1 | 2 | 0 | 2.0 |
| Oct 20 | Concordia | W, 81-56 | 1 | 0 | - | 0.3 |
| Nov 3 | at Guelph | W, 86-66 | 1 | 2 | - | 0.3 |
| Nov 10 | at Windsor | W, 81-68 | 1 | 2 | 0 | 1.5 |
| Nov 11 | at Western | W, 84-77 | 1 | 1 | - | 0.5 |
| Nov 17 | Lakehead | W, 97-81 | 1 | 0 | - | 0.0 |
| Nov 18 | Brock | W, 73-63 | 1 | 1 | - | 3.0 |
| Nov 24 | at Nipissing | W, 97-69 | 1 | 2 | - | 3.0 |
| Nov 25 | at Laurentian | W, 84-59 | 1 | 5 | 1 | 2.0 |
| Dec 1 | at York | W, 86-75 | 1 | 2 | - | 0.5 |
| Dec 2 | at McMaster | W, 72-59 | 1 | 4 | - | - |
| Dec 6 | Carleton | W, 79-78 | 1 | 1 | - | 0.0 |
| Dec 28 | Winnipeg | W, 78-67 | 1 | 2 | - | 0.0 |
| Dec 29 | vs. StFX | L, 104-81 | 1 | 3 | - | 0.3 |
| Dec 30 | at Laval | W, 90-60 | 1 | 1 | - | 1.0 |
| Jan 5 | Queen's | L, 96-95 | - | - | - | - |
| Jan 6 | Ontario Tech | W, 75-65 | - | - | - | - |
| Jan 12 | Laurentian | W, 69-56 | - | - | - | - |
| Jan 13 | Nipissing | W, 79-56 | - | - | - | - |
| Jan 19 | at Algoma | W, 87-50 | - | - | - | - |
| Jan 26 | Waterloo | W, 63-46 | 1 | 2 | - | 1.0 |
| Jan 27 | Laurier | W, 75-67 | 1 | 4 | - | 0.0 |
| Feb 2 | vs. Carleton | W, 71-61 | 1 | 2 | - | - |
| Feb 9 | Toronto Metropolitan | W, 69-52 | 1 | 1 | - | 0.7 |
| Feb 10 | Toronto | L, 76-70 | 1 | 2 | - | - |
| Feb 16 | at Queen's | L, 89-88 | 1 | 3 | - | 1.3 |
| Feb 17 | at Ontario Tech | W, 69-66 | 1 | 2 | - | 1.0 |
| gp | min/g | fg/g | 3pt/g | ft/g | ppg | |
|---|---|---|---|---|---|---|
| Event | ||||||
| Total | 17 | 27.4 | 4.1-10.5 | 1.4-4.6 | 2.0-2.6 | 11.5 |
| Conference | 17 | 27.4 | 4.1-10.5 | 1.4-4.6 | 2.0-2.6 | 11.5 |
| Exhibition | 8 | 25.5 | 4.6-10.2 | 1.8-5.6 | 1.2-2.2 | 12.3 |
| Location | ||||||
| Home | 7 | 27.7 | 4.1-11.0 | 1.4-4.9 | 2.3-3.1 | 12.0 |
| Away | 9 | 27.3 | 4.3-10.3 | 1.6-4.6 | 1.8-2.3 | 12.0 |
| Neutral | 1 | 26.0 | 1.0-8.0 | 0.0-4.0 | 2.0-2.0 | 4.0 |
| Result | ||||||
| Wins | 15 | 27.2 | 4.2-10.7 | 1.3-4.5 | 1.9-2.5 | 11.6 |
| Losses | 2 | 29.0 | 3.0-8.5 | 2.5-5.5 | 2.5-4.0 | 11.0 |
| Month | ||||||
| November | 7 | 25.0 | 4.6-11.0 | 1.1-4.3 | 2.4-3.3 | 12.7 |
| December | 3 | 30.7 | 4.3-10.7 | 1.3-4.0 | 1.0-1.3 | 11.0 |
| January | 2 | 31.0 | 5.0-12.0 | 3.0-6.5 | 2.5-3.0 | 15.5 |
| February | 5 | 27.4 | 2.8-9.0 | 1.2-4.8 | 1.8-2.4 | 8.6 |
Splits Stats: Shooting per game
| gp | gs | min | fg | pct | 3pt | pct | ft | pct | pts | |
|---|---|---|---|---|---|---|---|---|---|---|
| Event | ||||||||||
| Total | 17 | 17 | 466 | 69-178 | 38.8 | 24-79 | 30.4 | 34-45 | 75.6 | 196 |
| Conference | 17 | 17 | 466 | 69-178 | 38.8 | 24-79 | 30.4 | 34-45 | 75.6 | 196 |
| Exhibition | 8 | 7 | 204 | 37-82 | 45.1 | 14-45 | 31.1 | 10-18 | 55.6 | 98 |
| Location | ||||||||||
| Home | 7 | 7 | 194 | 29-77 | 37.7 | 10-34 | 29.4 | 16-22 | 72.7 | 84 |
| Away | 9 | 9 | 246 | 39-93 | 41.9 | 14-41 | 34.1 | 16-21 | 76.2 | 108 |
| Neutral | 1 | 1 | 26 | 1-8 | 12.5 | 0-4 | 0.0 | 2-2 | 100.0 | 4 |
| Result | ||||||||||
| Wins | 15 | 15 | 408 | 63-161 | 39.1 | 19-68 | 27.9 | 29-37 | 78.4 | 174 |
| Losses | 2 | 2 | 58 | 6-17 | 35.3 | 5-11 | 45.5 | 5-8 | 62.5 | 22 |
| Month | ||||||||||
| November | 7 | 7 | 175 | 32-77 | 41.6 | 8-30 | 26.7 | 17-23 | 73.9 | 89 |
| December | 3 | 3 | 92 | 13-32 | 40.6 | 4-12 | 33.3 | 3-4 | 75.0 | 33 |
| January | 2 | 2 | 62 | 10-24 | 41.7 | 6-13 | 46.2 | 5-6 | 83.3 | 31 |
| February | 5 | 5 | 137 | 14-45 | 31.1 | 6-24 | 25.0 | 9-12 | 75.0 | 43 |
Splits Stats: Shooting totals
| gp | min | min/g | fg/40 | 3pt/40 | pct | ft/40 | pts/40 | |
|---|---|---|---|---|---|---|---|---|
| Event | ||||||||
| Total | 17 | 466 | 27.4 | 5.9-15.3 | 2.1-6.8 | 30.4 | 2.9-3.9 | 16.8 |
| Conference | 17 | 466 | 27.4 | 5.9-15.3 | 2.1-6.8 | 30.4 | 2.9-3.9 | 16.8 |
| Exhibition | 8 | 204 | 25.5 | 7.3-16.1 | 2.7-8.8 | 31.1 | 2.0-3.5 | 19.2 |
| Location | ||||||||
| Home | 7 | 194 | 27.7 | 6.0-15.9 | 2.1-7.0 | 29.4 | 3.3-4.5 | 17.3 |
| Away | 9 | 246 | 27.3 | 6.3-15.1 | 2.3-6.7 | 34.1 | 2.6-3.4 | 17.6 |
| Neutral | 1 | 26 | 26.0 | 1.5-12.3 | 0.0-6.2 | 0.0 | 3.1-3.1 | 6.2 |
| Result | ||||||||
| Wins | 15 | 408 | 27.2 | 6.2-15.8 | 1.9-6.7 | 27.9 | 2.8-3.6 | 17.1 |
| Losses | 2 | 58 | 29.0 | 4.1-11.7 | 3.4-7.6 | 45.5 | 3.4-5.5 | 15.2 |
| Month | ||||||||
| November | 7 | 175 | 25.0 | 7.3-17.6 | 1.8-6.9 | 26.7 | 3.9-5.3 | 20.3 |
| December | 3 | 92 | 30.7 | 5.7-13.9 | 1.7-5.2 | 33.3 | 1.3-1.7 | 14.3 |
| January | 2 | 62 | 31.0 | 6.5-15.5 | 3.9-8.4 | 46.2 | 3.2-3.9 | 20.0 |
| February | 5 | 137 | 27.4 | 4.1-13.1 | 1.8-7.0 | 25.0 | 2.6-3.5 | 12.6 |
Splits Stats: Shooting per 40 min
| gp | off/g | def/g | reb/g | ast/g | to/g | stl/g | blk/g | |
|---|---|---|---|---|---|---|---|---|
| Event | ||||||||
| Total | 17 | 1.5 | 3.6 | 5.1 | 1.4 | 1.5 | 1.5 | 0.2 |
| Conference | 17 | 1.5 | 3.6 | 5.1 | 1.4 | 1.5 | 1.5 | 0.2 |
| Exhibition | 8 | 1.0 | 3.9 | 4.9 | 1.3 | 2.0 | 1.8 | 0.3 |
| Location | ||||||||
| Home | 7 | 1.3 | 3.9 | 5.1 | 1.0 | 1.4 | 1.7 | 0.1 |
| Away | 9 | 1.8 | 3.4 | 5.2 | 1.8 | 1.7 | 1.3 | 0.2 |
| Neutral | 1 | 0.0 | 3.0 | 3.0 | 0.0 | 0.0 | 2.0 | 0.0 |
| Result | ||||||||
| Wins | 15 | 1.6 | 3.6 | 5.2 | 1.2 | 1.5 | 1.6 | 0.1 |
| Losses | 2 | 0.5 | 3.5 | 4.0 | 2.5 | 1.5 | 1.0 | 0.5 |
| Month | ||||||||
| November | 7 | 2.3 | 3.9 | 6.1 | 1.9 | 1.6 | 1.1 | 0.1 |
| December | 3 | 1.0 | 3.3 | 4.3 | 0.3 | 1.0 | 2.0 | 0.3 |
| January | 2 | 1.0 | 3.0 | 4.0 | 0.5 | 2.0 | 3.0 | 0.0 |
| February | 5 | 0.8 | 3.6 | 4.4 | 1.6 | 1.4 | 1.2 | 0.2 |
Splits Stats: Ball control per game
| gp | gs | off | def | reb | ast | to | stl | blk | |
|---|---|---|---|---|---|---|---|---|---|
| Event | |||||||||
| Total | 17 | 17 | 25 | 61 | 86 | 23 | 25 | 26 | 3 |
| Conference | 17 | 17 | 25 | 61 | 86 | 23 | 25 | 26 | 3 |
| Exhibition | 8 | 7 | 8 | 31 | 39 | 10 | 16 | 14 | 2 |
| Location | |||||||||
| Home | 7 | 7 | 9 | 27 | 36 | 7 | 10 | 12 | 1 |
| Away | 9 | 9 | 16 | 31 | 47 | 16 | 15 | 12 | 2 |
| Neutral | 1 | 1 | 0 | 3 | 3 | 0 | 0 | 2 | 0 |
| Result | |||||||||
| Wins | 15 | 15 | 24 | 54 | 78 | 18 | 22 | 24 | 2 |
| Losses | 2 | 2 | 1 | 7 | 8 | 5 | 3 | 2 | 1 |
| Month | |||||||||
| November | 7 | 7 | 16 | 27 | 43 | 13 | 11 | 8 | 1 |
| December | 3 | 3 | 3 | 10 | 13 | 1 | 3 | 6 | 1 |
| January | 2 | 2 | 2 | 6 | 8 | 1 | 4 | 6 | 0 |
| February | 5 | 5 | 4 | 18 | 22 | 8 | 7 | 6 | 1 |
Splits Stats: Ball control totals
| gp | off/40 | def/40 | reb/40 | ast/40 | to/40 | stl/40 | blk/40 | |
|---|---|---|---|---|---|---|---|---|
| Event | ||||||||
| Total | 17 | 2.1 | 5.2 | 7.4 | 2.0 | 2.1 | 2.2 | 0.3 |
| Conference | 17 | 2.1 | 5.2 | 7.4 | 2.0 | 2.1 | 2.2 | 0.3 |
| Exhibition | 8 | 1.6 | 6.1 | 7.6 | 2.0 | 3.1 | 2.7 | 0.4 |
| Location | ||||||||
| Home | 7 | 1.9 | 5.6 | 7.4 | 1.4 | 2.1 | 2.5 | 0.2 |
| Away | 9 | 2.6 | 5.0 | 7.6 | 2.6 | 2.4 | 2.0 | 0.3 |
| Neutral | 1 | 0.0 | 4.6 | 4.6 | 0.0 | 0.0 | 3.1 | 0.0 |
| Result | ||||||||
| Wins | 15 | 2.4 | 5.3 | 7.6 | 1.8 | 2.2 | 2.4 | 0.2 |
| Losses | 2 | 0.7 | 4.8 | 5.5 | 3.4 | 2.1 | 1.4 | 0.7 |
| Month | ||||||||
| November | 7 | 3.7 | 6.2 | 9.8 | 3.0 | 2.5 | 1.8 | 0.2 |
| December | 3 | 1.3 | 4.3 | 5.7 | 0.4 | 1.3 | 2.6 | 0.4 |
| January | 2 | 1.3 | 3.9 | 5.2 | 0.6 | 2.6 | 3.9 | 0.0 |
| February | 5 | 1.2 | 5.3 | 6.4 | 2.3 | 2.0 | 1.8 | 0.3 |
Splits Stats: Ball control per 40 min
News mentions

RECAP: #1 Ottawa sweeps weekend in Northern Ontario
November 26, 2023
RECAP: Gee-Gees power to 20-point season opening win in Guelph
November 4, 2023